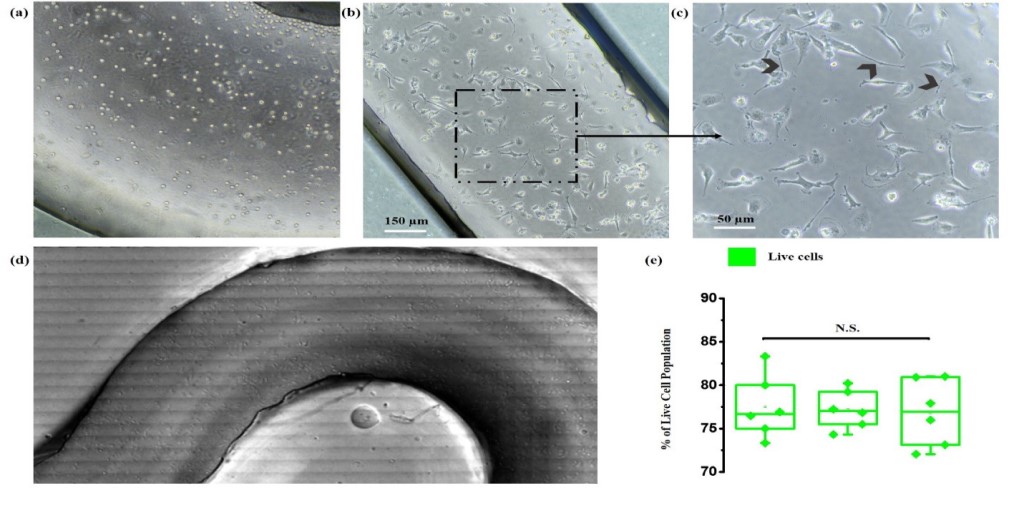
Cell growth in 3D printed biochip. Phase contrast imaging of cell morphology inside the channel for and differential interference contrast imaging of cell morphology in chip with panorama imaging
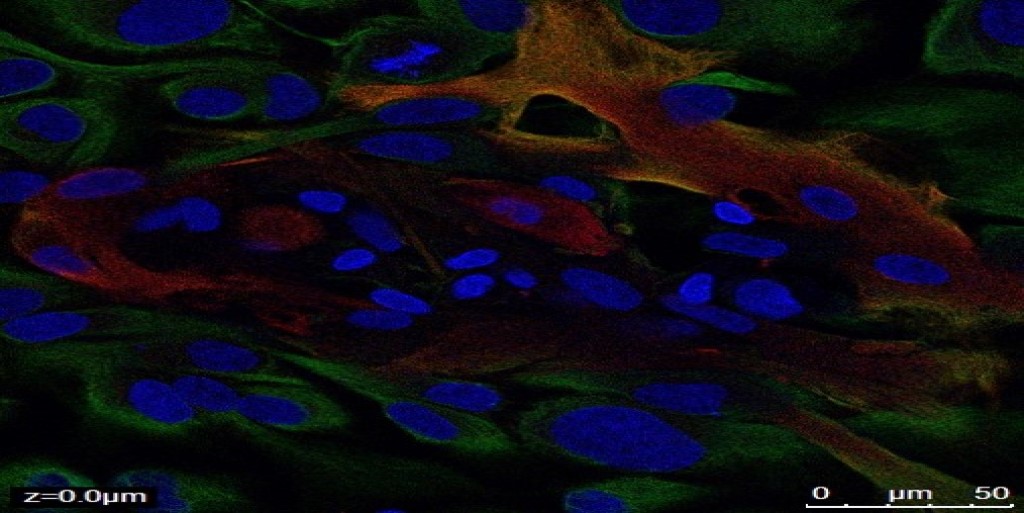
Characterization of mixed retinal culture using resonance scanning (laser scanning confocal microscopy).
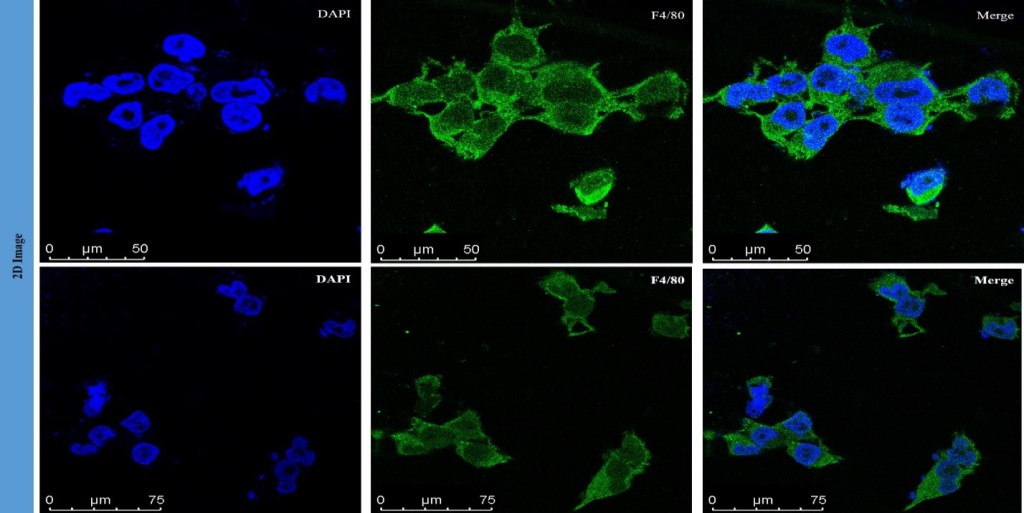
High resolution imaging (2D) of F4/80 protein in resting microglia (HCM3) using laser scanning confocal microscopy (immunohistochemistry experiment). Blue - DAPI, green - protein.
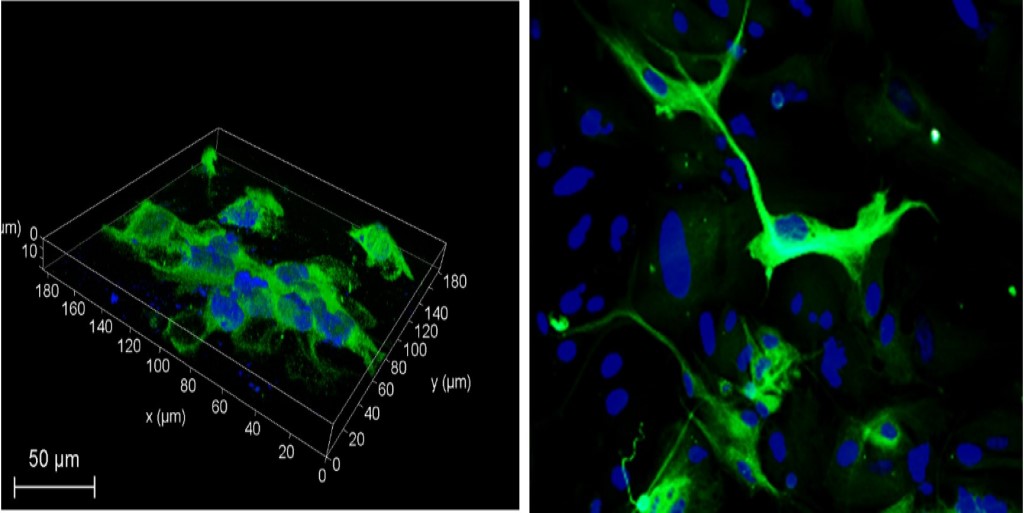
High resolution imaging (3D) of F4/80 protein in resting microglia (HCM3) using laser scanning confocal microscopy (immunohistochemistry experiment). Blue -DAPI, green - protein.

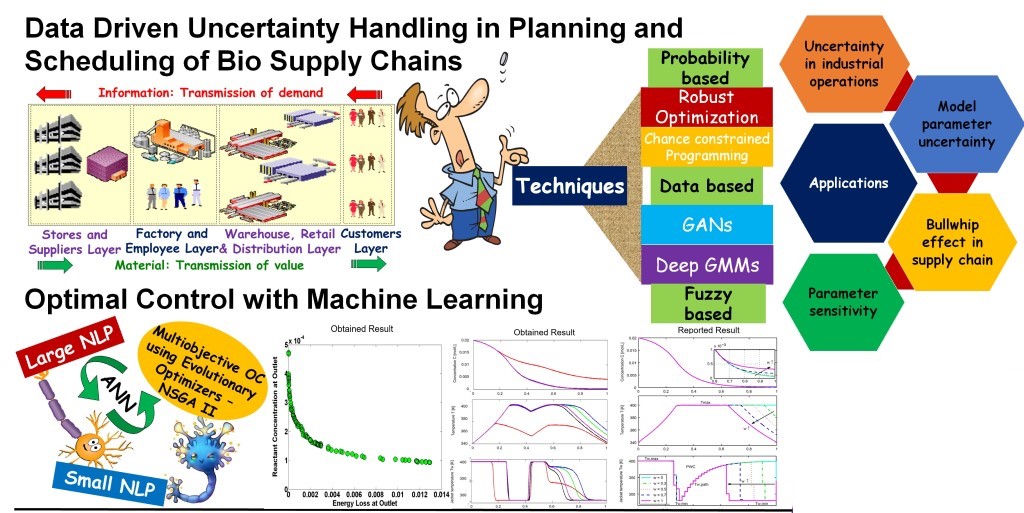
Data driven uncertainty Handling in Planning and Scheduling of Bio Supply Chains
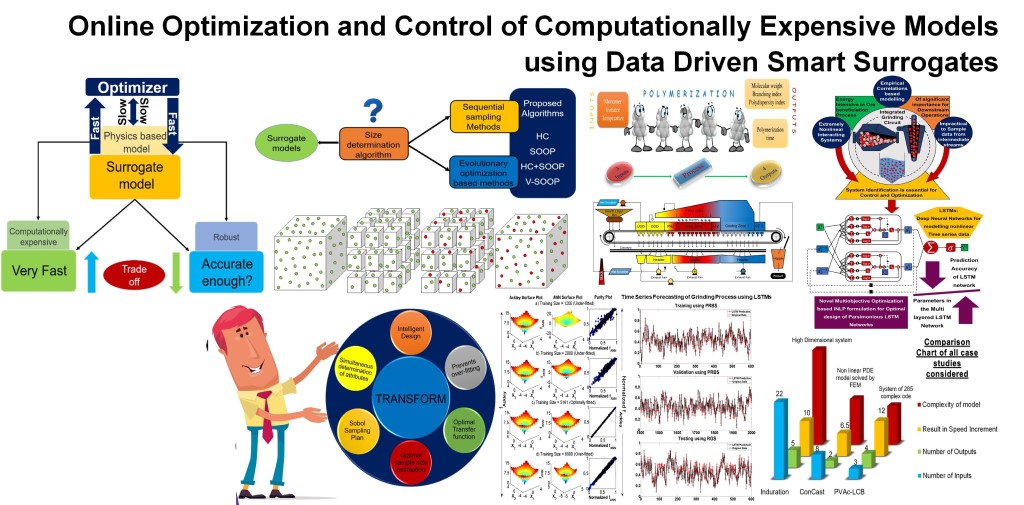
Online Optimization and Control of Computationally Expensive Models using Data Driven Smart Surrogates
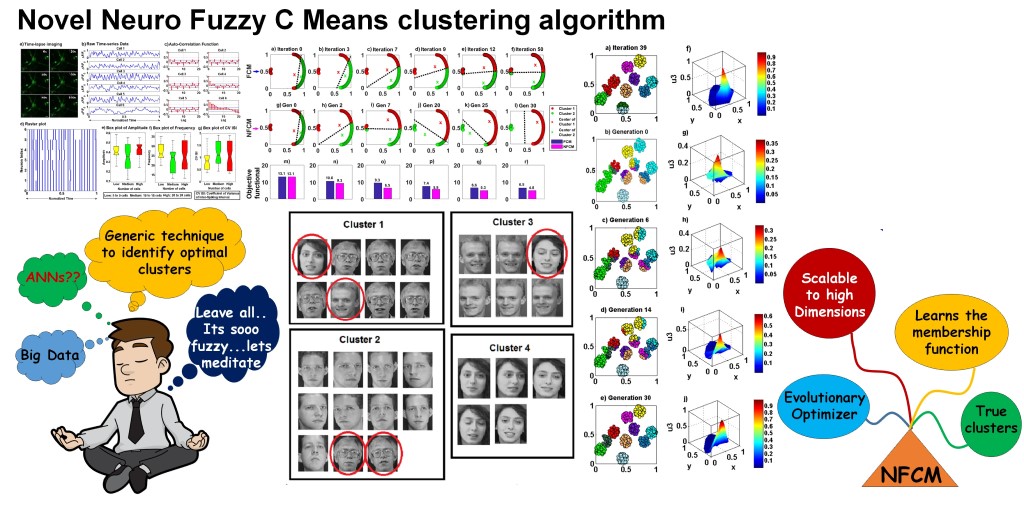
Novel Neuro Fuzzy C Means clustering algorithm
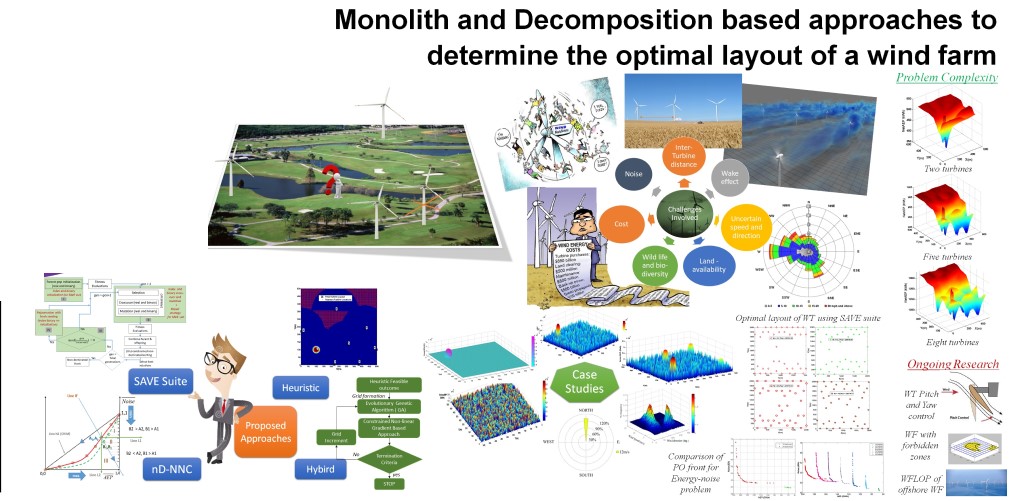
Monolith and Decomposition based approaches to determine the optimal layout of a wind farm
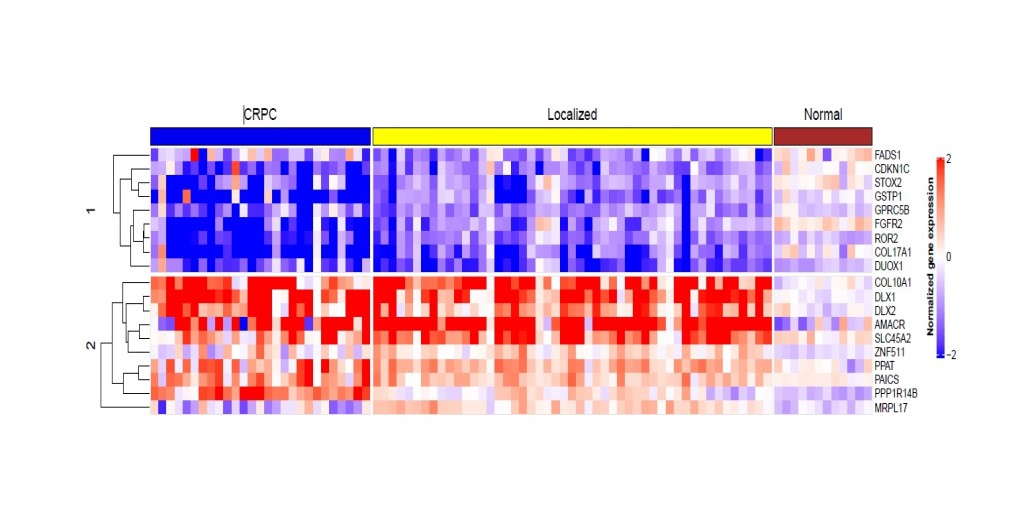
Heatmap based hierarchical clustering representing differential gene expression profile of 19 highly significantly altered genes in Castration-Resistant (CRPC) and Localized Prostate Cancer patient samples compared to Normal tissues(from right to left). (Dataset- Grasso et. al, Nature; 2012). Associations with overexpression are colored red, and underexpression are colored blue.

Microfluidics for nanomaterial synthesis

Noninvasive biomaterial separation

Tissue scaffold material made from recycled polystyrene macrofibrous fabric and bacterial nanofibrous cellulose

Antifungal (culinary spice derived) herbal essential oil microcapsules loaded nanocellulose
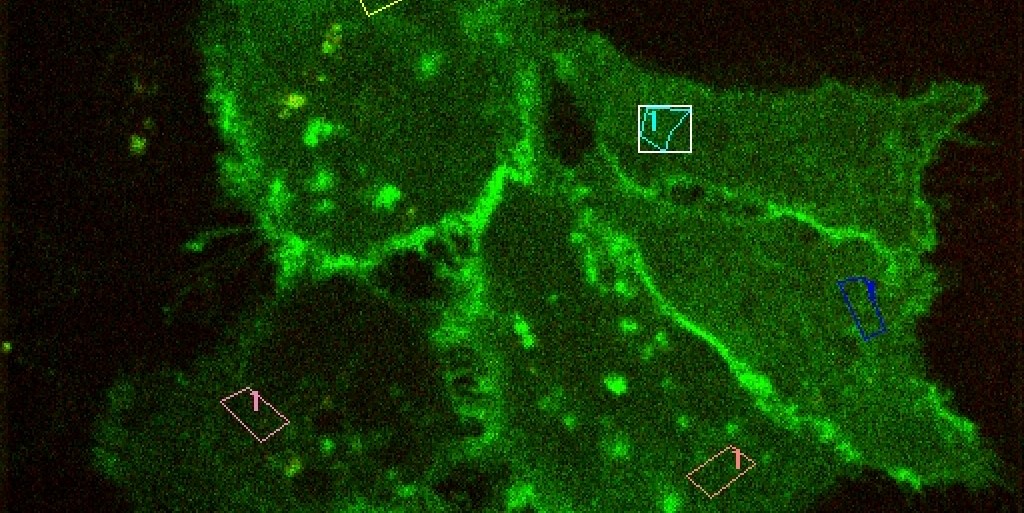
LG Hela ph-GFP norep 200 uM frame 30 dish
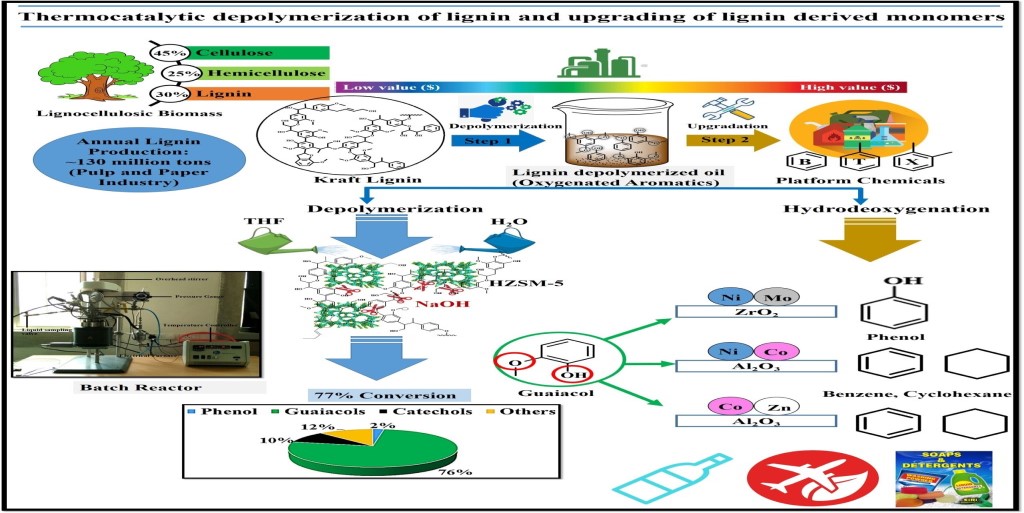
Thermocatalytic depolymerization of lignin and upgrading of lignin derived monomers
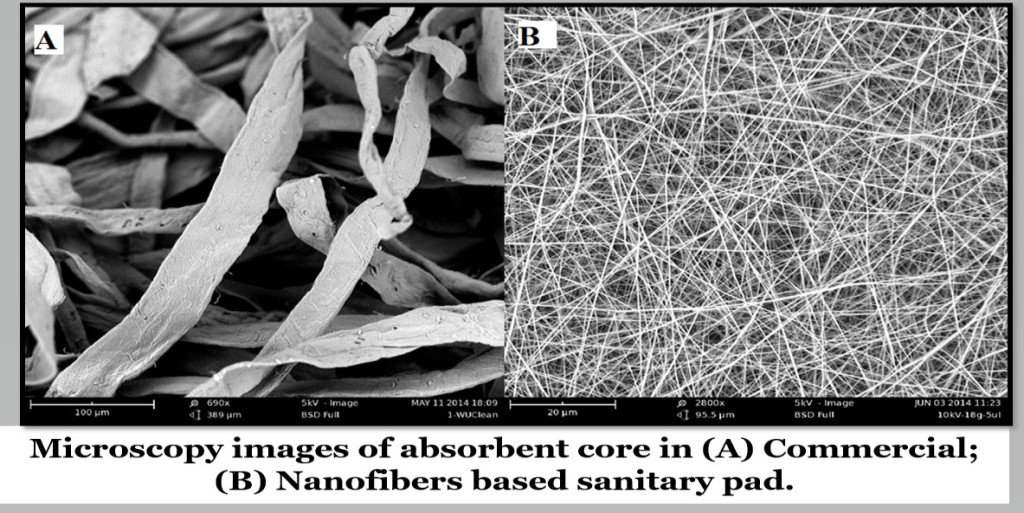
Nanofibers based Saniatry napkins

Design of Shape-Controlled CeO2-based Novel Catalysts for Production of 2,5-Furandicarboxylic Acid from Biomass

Catalytic Transfer Hydrogenation of Furfural to biofuels over Solid Acid-Base Catalysts

Conversion of n-Butanol to Hydrocarbons